Mar 13, 2025
Eurex
Focus on VSTOXX® Derivatives | February 2025 recap
- European markets continue their strong advance despite geopolitical tensions
- As indexes rally, the implied-to-realized spread is widening
- Skew also widens with index levels at year highs
- Correlation/dispersion suggest single name movement drives the market
February 2025 in Review
Undoubtedly, European equity markets are off to a fast start in 2025. This may seem surprising, given the threat of tariffs from the US. However, given recent election results, the potential for fiscal stimulus, particularly in defense, coupled with stimulative central banks, results in money rotating back to the continent.
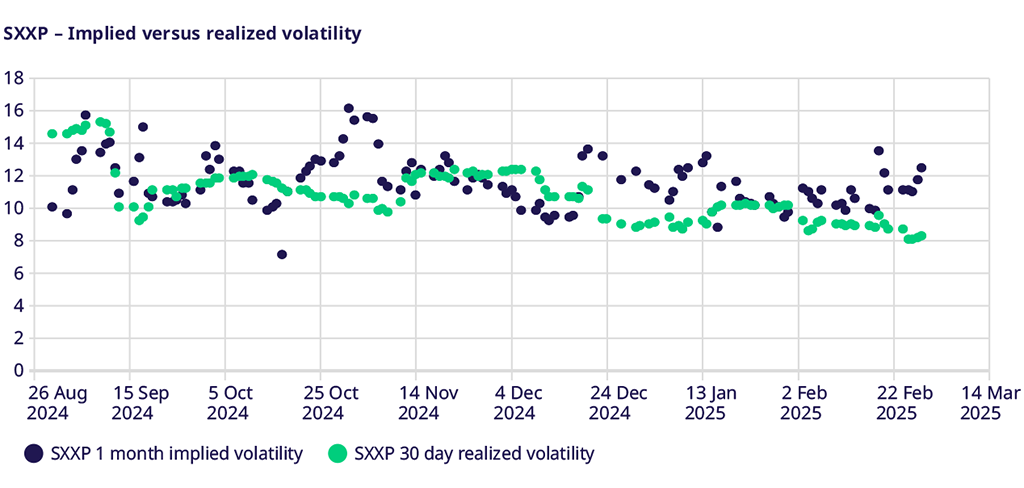
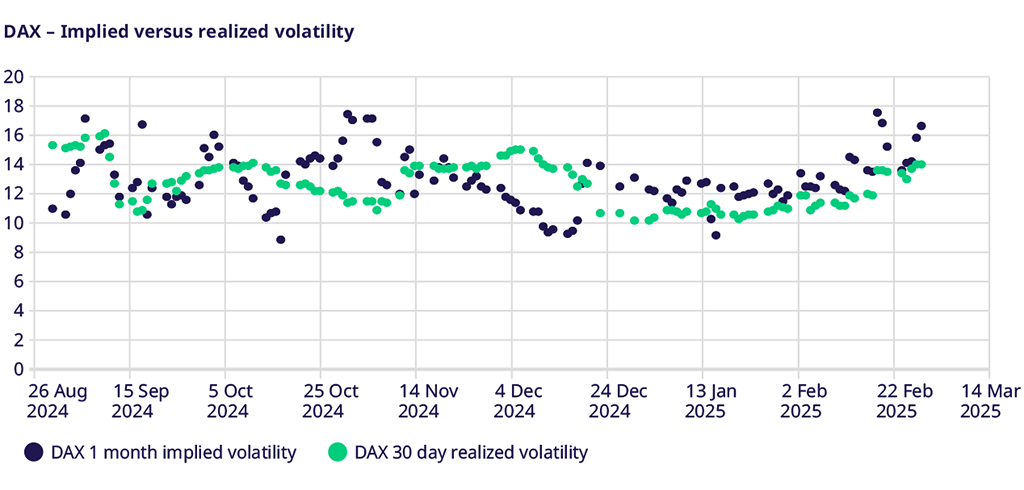
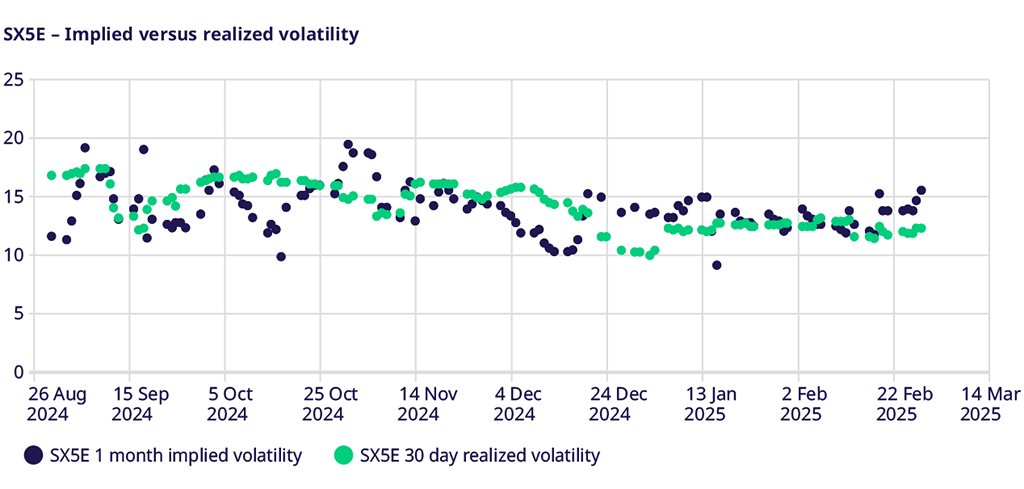
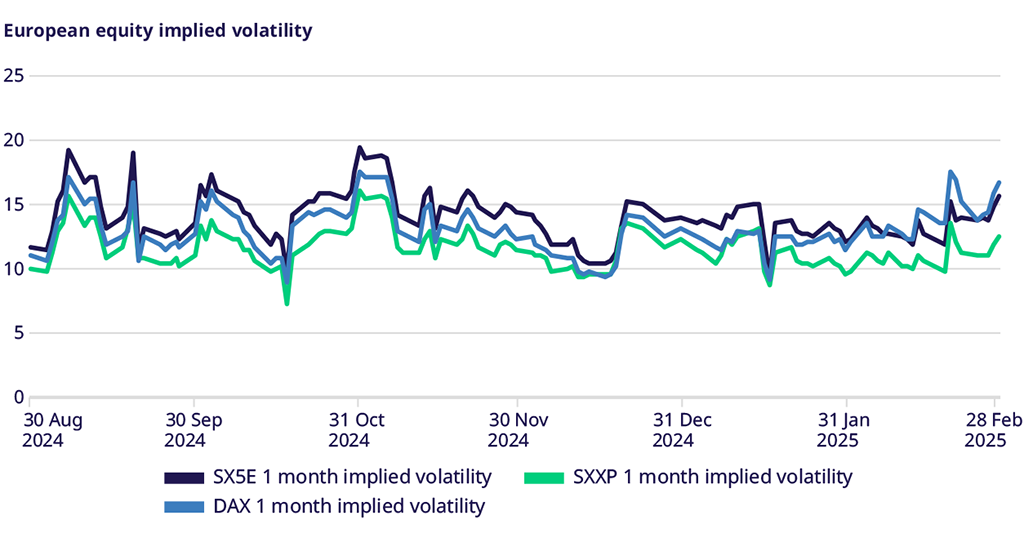
February performance continued January’s strong start as, right now, the STOXX® Europe 600 Index / SXXP (Eurex Futures and Options) is up 9.77% YTD (4.81% in Feb), EURO STOXX 50® Index / SX5E (Eurex Futures and Options) up 11.6% (3.34 in Feb) and the German DAX / GDAXI (Eurex Futures and Options) up 13.27% (3.77% in Feb). This market strength widens the gap between implied and realized volatility. Option traders maintain considerable expectations for a rebound in volatility amid the current geopolitical climate, even as the consistent upward trend dampens realized volatility. The STOXX® Europe 600 Index implied-minus-realized ended the month above four vol points, the highest since the US election. The EURO STOXX 50® Index was above three vol points, and the German DAX was just under three vol points based on the same implied-to-realized spread, both at their widest levels since the US election.
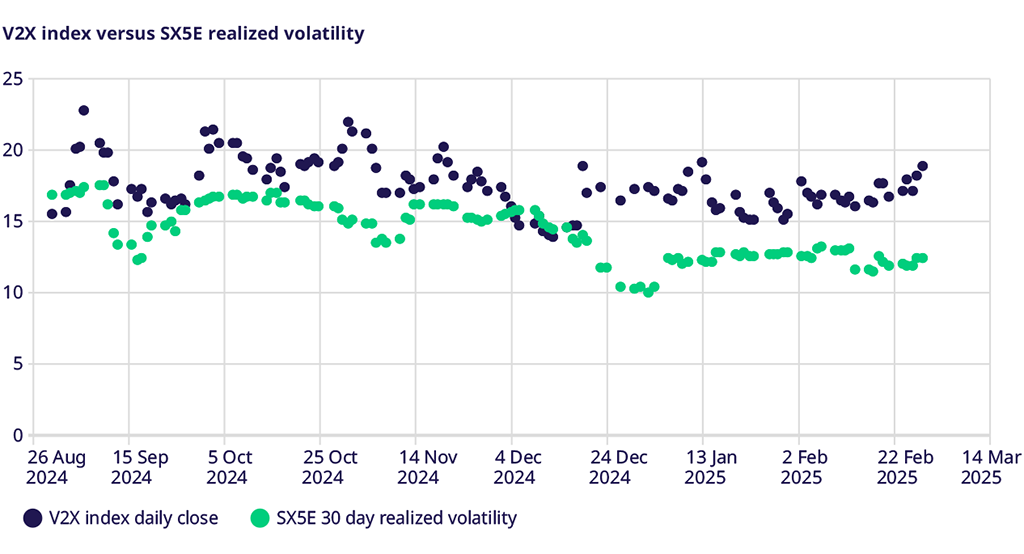
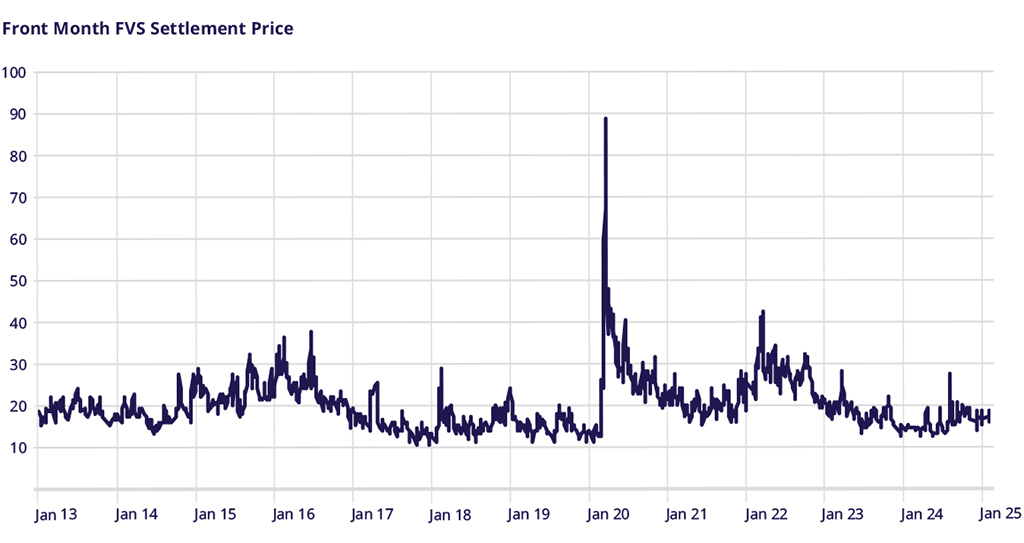
V2X Index performance
This same risk premium widening was apparent in the V2X market, as the index climbed steadily higher throughout the month from mid-16 to close at 18.62. With the SX5E realized volatility closing the month at 12.23, the gap between implied and realized volatility was quite broad, similar to what one might observe during a holiday season, such as Christmas trading.
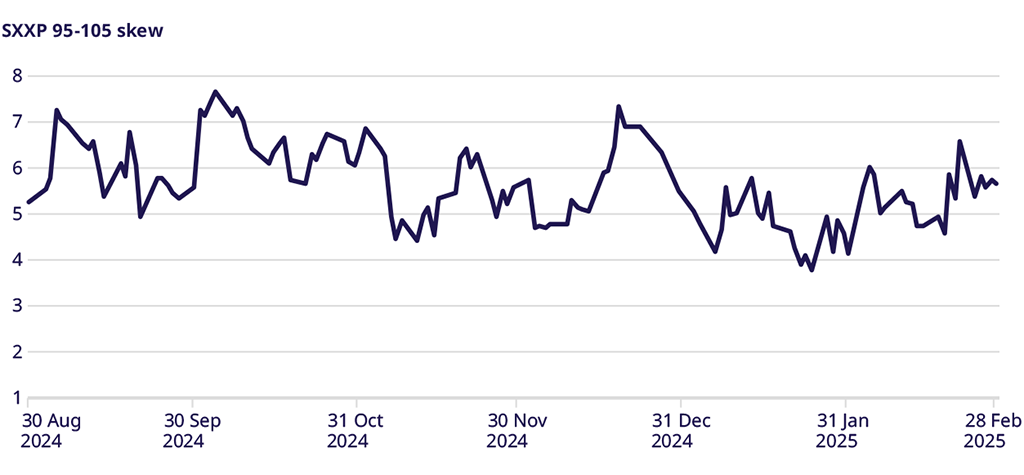
SXXP Index Skew
The relative demand for downside puts vs. upside calls also widened, with the markets continuing to hit new highs for the year in February. The 95%-105% implied volatility spread ended the month at 5.67 vol points but did get above six occasionally. While this is well off the higher levels seen last summer, the steady move higher suggests continued relative demand.
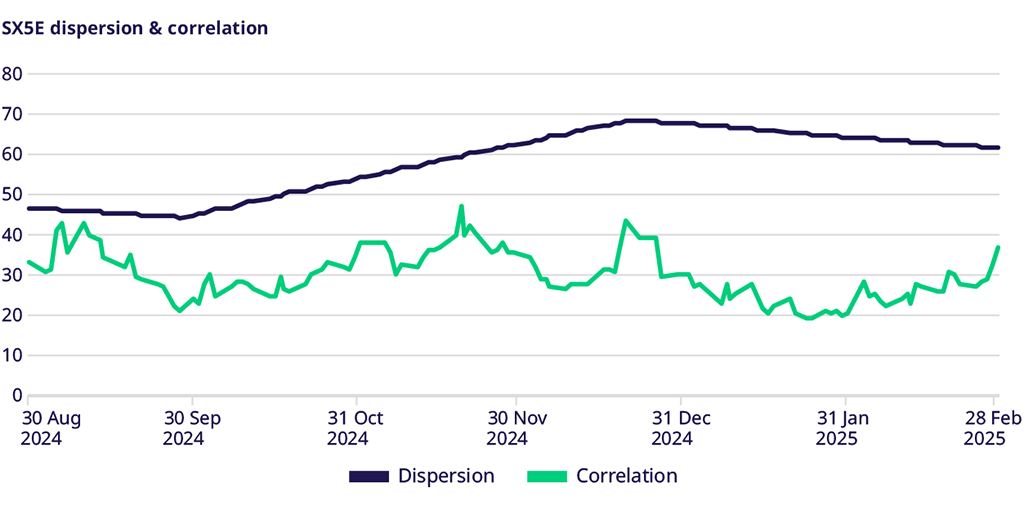
Correlation & Dispersion
This month, we examine correlation and dispersion. Analyzing the SX5E realized dispersion index, we observe that the 1-year moving average remained above 60% throughout 2024. This index is built with daily at-the-money straddles in the index and the individual names. It measures the difference between the index’s return and the return of its constituents and resets to 100 every year. We use a 1-year moving average to smooth out this calculation. A level of 60% suggests that most of the index level movement is driven by single-name volatility. We can also examine the EURO STOXX 50® Index one-month implied correlation. This has remained below 40 and has only recently increased from its six-month lows observed in January. This also suggests that the market anticipates future volatility to be driven by single-name movements rather than index movements.
Trade the European volatility benchmark
Explore this year's macro events and find an overview of dates.
VSTOXX 101: Understanding Europe’s Volatility Benchmark
Discover the latest STOXX whitepaper today to learn more about the VSTOXX® core methodology, historical performance analysis, and more.
For more information, please visit the website or contact: