Apr 11, 2025
Eurex
Focus on VSTOXX® Derivatives | March 2025 recap
- European markets were down 2-4% over the month of March
- With indexes down, implied volatility moved up. However, the spread between implied and realized volatility decreased, indicating a lack of stress in the markets
- Skew stayed constant during March, suggesting no increased demand for downside options to hedge portfolios
- Correlation/dispersion still suggests single names and sector rotation are the themes for the year
Equity Index Volatility
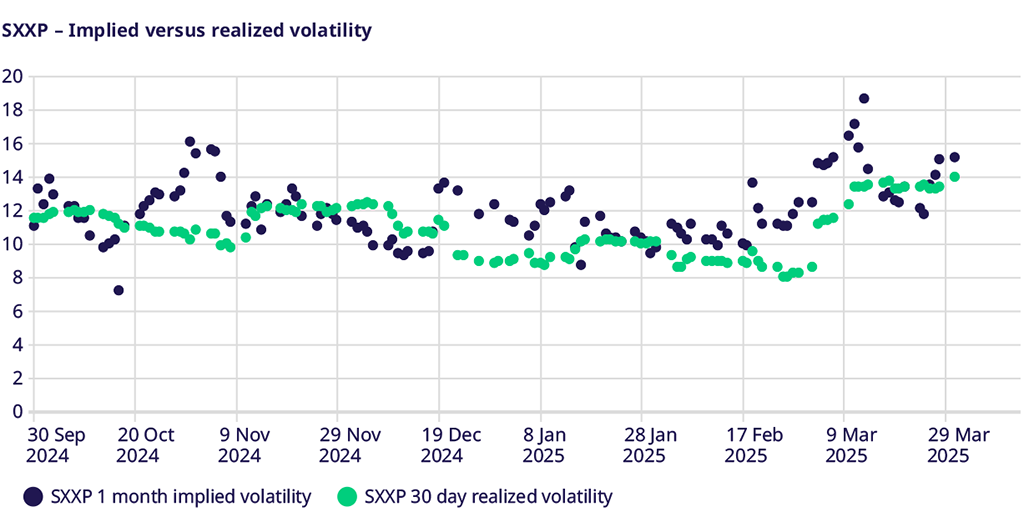
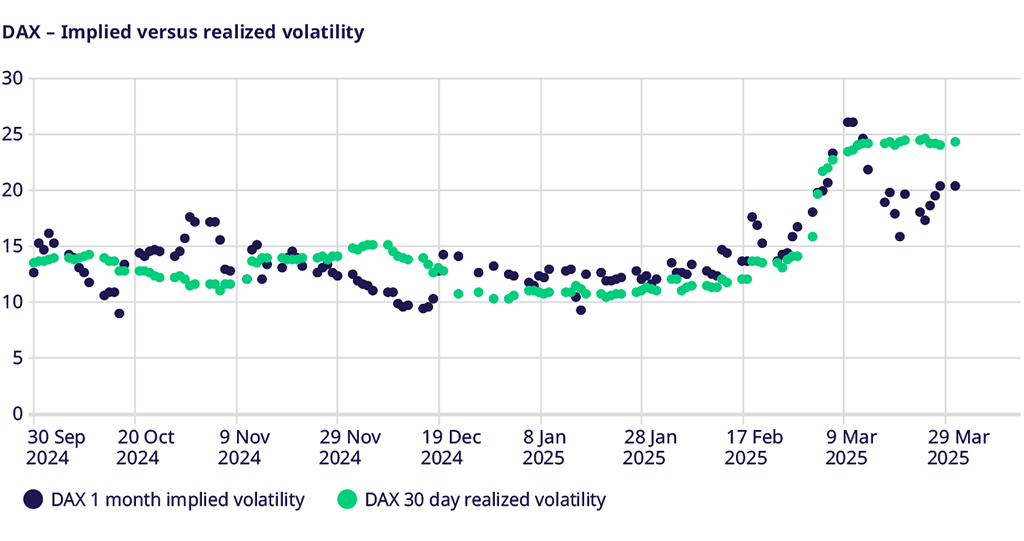
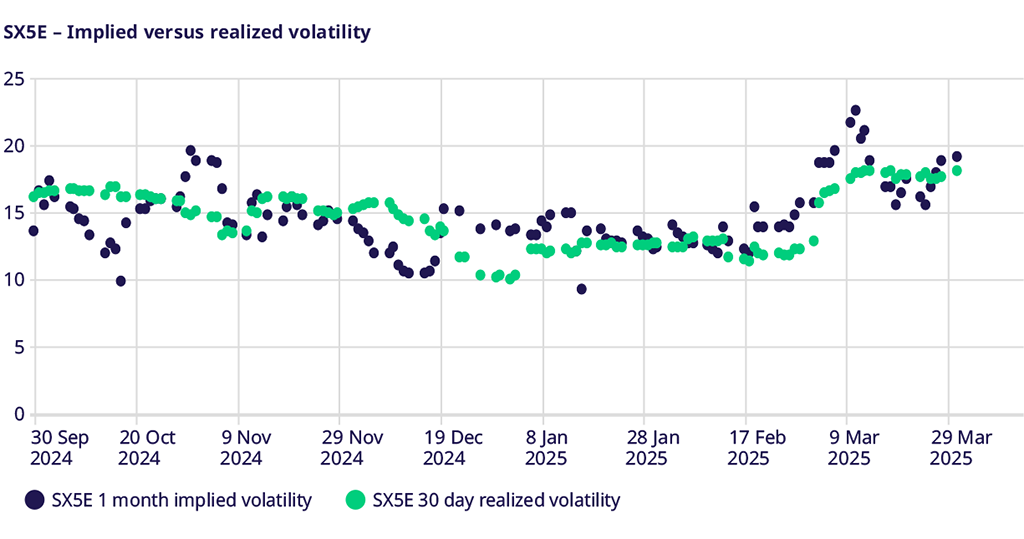
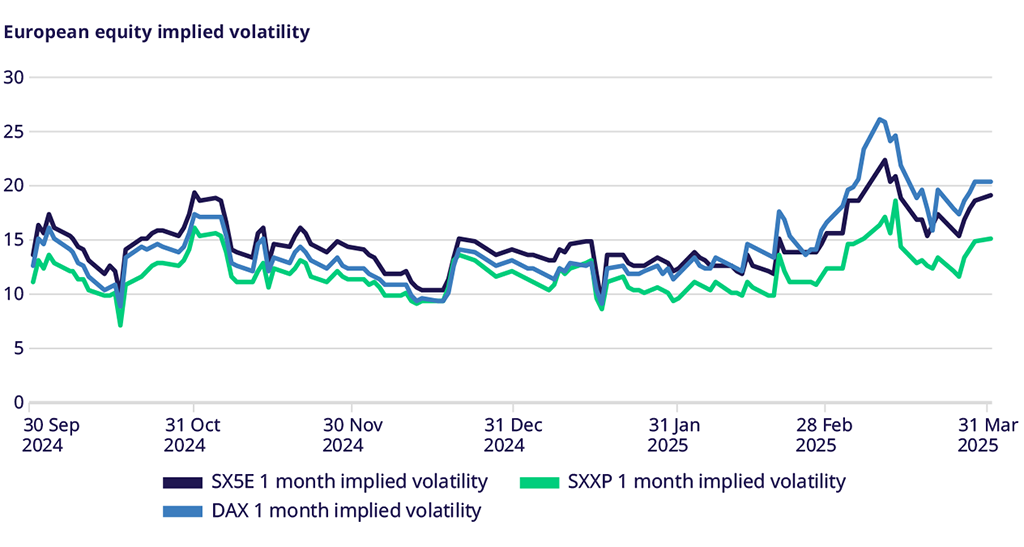
Over the course of the month, equity implied volatility rose across the board, ranging from 2 vol points in the DAX Index to almost 3 vol points in the STOXX® Europe 600 Index. This should not be surprising given the historically negative correlation between equity index volatility and index price performance. With index prices down from 1.7% in the DAX Index to 4.2% in the STOXX® Europe 600 Index, the historical relationship held true to form. However, it is interesting to note that while implied volatility increased inversely with index prices, the spread between implied volatility (what is expected to happen) and realized volatility (the actual movement) tightened. In the STOXX® Europe 600 Index, the spread between implied and realized volatility fell from over five vol points to just over one vol point in March. The DAX fell from just over two vol points to a negative reading, with implied volatility trading below realized volatility, an uncommon outcome and one that can benefit traders with delta hedging skills.
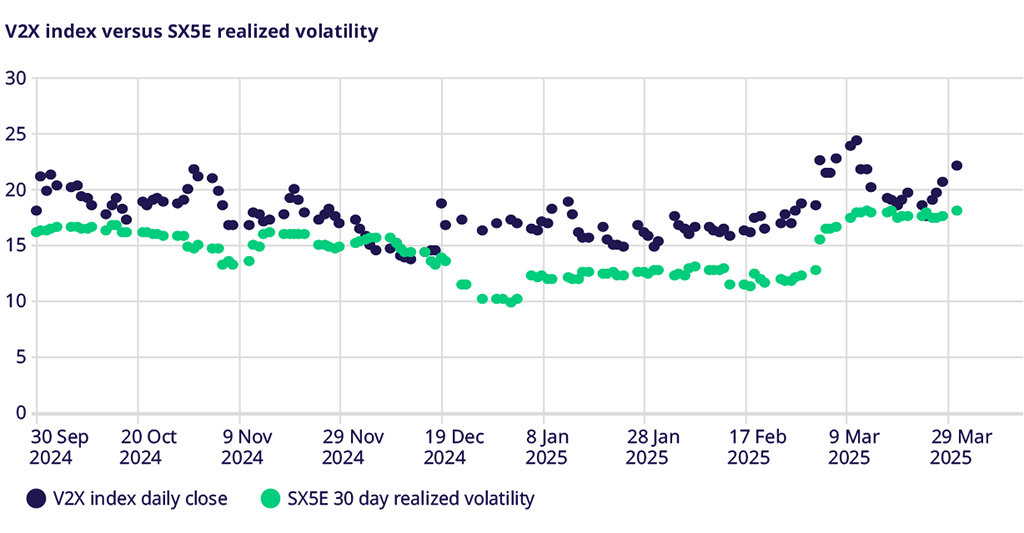
VSTOXX Index performance
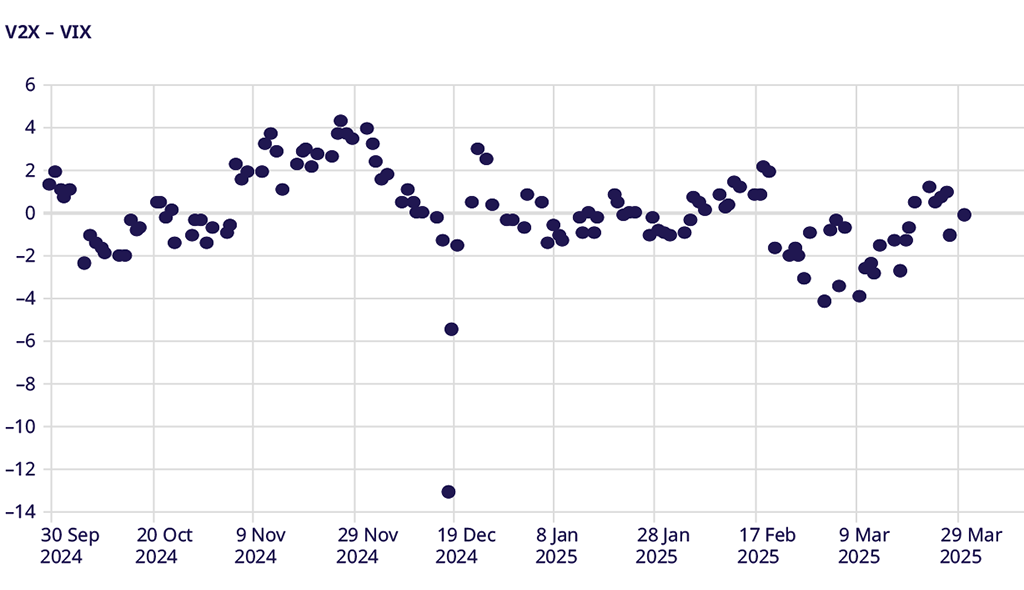
The VSTOXX Index rose from 18.63 to 22.15 over the course of March. This was less than the move higher in EURO STOXX 50® realized volatility, which rose from 12.23 to 18.04. One can see that the implied volatility market anticipated some of this realized vol but still sees more to come from the uncertainty surrounding changing global trade dynamics and still-lingering geopolitical concerns. With the spread between V2X and SX5E realized narrowing from about six points to 3.5 points, one might suggest that the potential for forward volatility expectations is somewhat declining. However, the 18.04 implied volatility implies a move of 1.14% every day for the next 30 days, which may not be a high hurdle rate given the sudden changes in news flow we have seen in equity markets over the past month. The V2X – VIX spread has been quite volatile itself lately, particularly around the US election, but with global economic implications of changes in trade, the volatility indexes ended the month of March at essentially the same level.
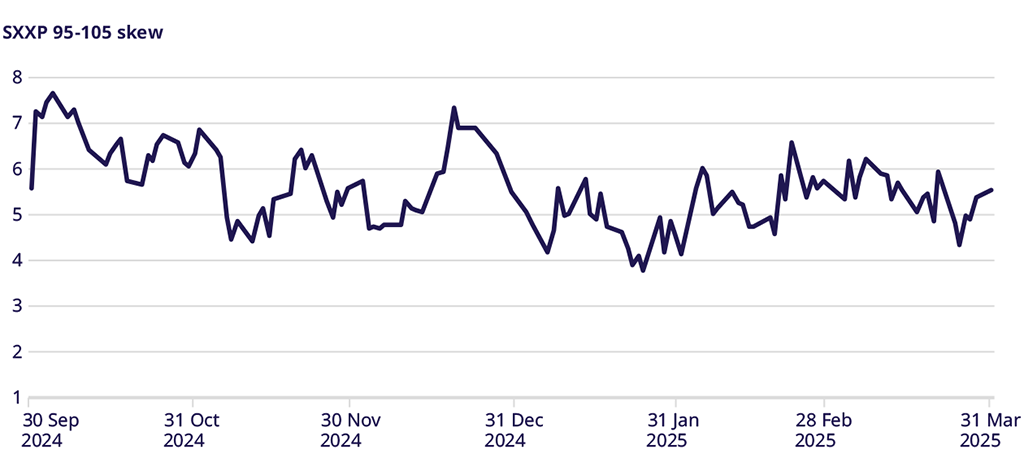
STOXX Europe 600 Index Skew
Skew in the STOXX® Europe 600 Index, measured by the difference between the implied volatility of the 95% out-of-the-money puts and 105% out-of-the-money calls, stayed constant at 5.6 volatility points. This is near the average for 2025, and this spread is lower than spreads that averaged over six vol points and hit levels above seven vol points in the selloffs in markets last summer. A relatively flat skew may be attributed to the January and February market rally. However, with skew staying constant despite lower index prices may suggest a current lack of investor concern as expressed by a lack of incremental demand for downside protection. For those concerned that these lower moves are just the beginning of a larger correction, relatively benign skew may present an opportunity to hedgers.
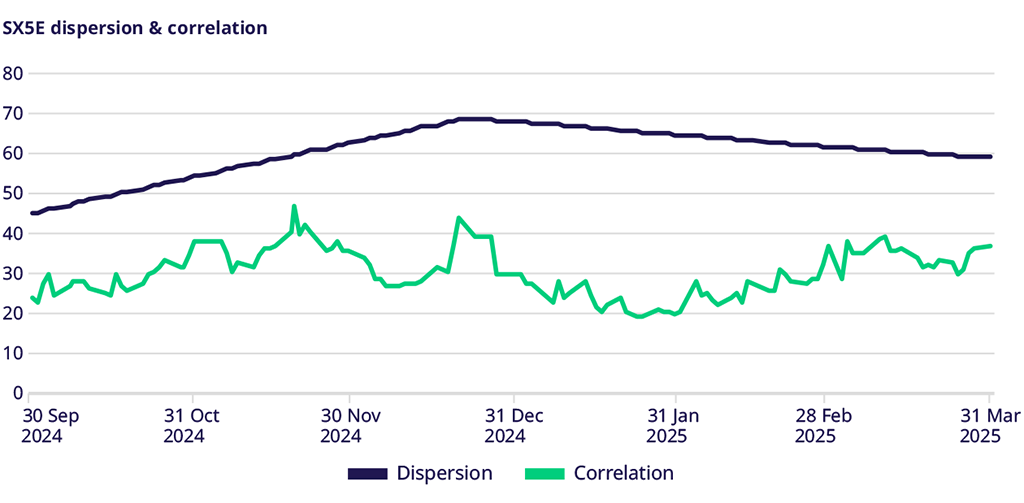
Correlation & Dispersion
Despite lower index prices, the implied correlation and dispersion of actual movement remained constant throughout March. The constant implied correlation and dispersion despite lower index prices indicate that investors have moved more to rotate within the index, moving to more defensive sectors like utilities, insurance, and energy, while moving out of more cyclical sectors such as travel & leisure, consumer discretionary and technology. The rotation within the index, rather than an outright sale of positions, resulted in slightly lower index prices overall and stable levels of correlation, which are currently closer to historical lows than to historical highs.
Trade the European volatility benchmark
Explore this year's macro events and find an overview of dates.
VSTOXX 101: Understanding Europe’s Volatility Benchmark
Discover the latest STOXX whitepaper today to learn more about the VSTOXX® core methodology, historical performance analysis, and more.
For more information, please visit the website or contact: